Aussie Property and Auction Report - August 20th 2022

Please note the following is based off preliminary numbers and is subject to significant changes once unreported auctions are chased up.
It should be taken as an extremely rough and preliminary indicator, before other data sources fill in the blank later next week.
For those wanting more accurate data with the missing pieces filled in, that is posted here by the great team at SQM Research on Tuesdays.
Auction Action Summary
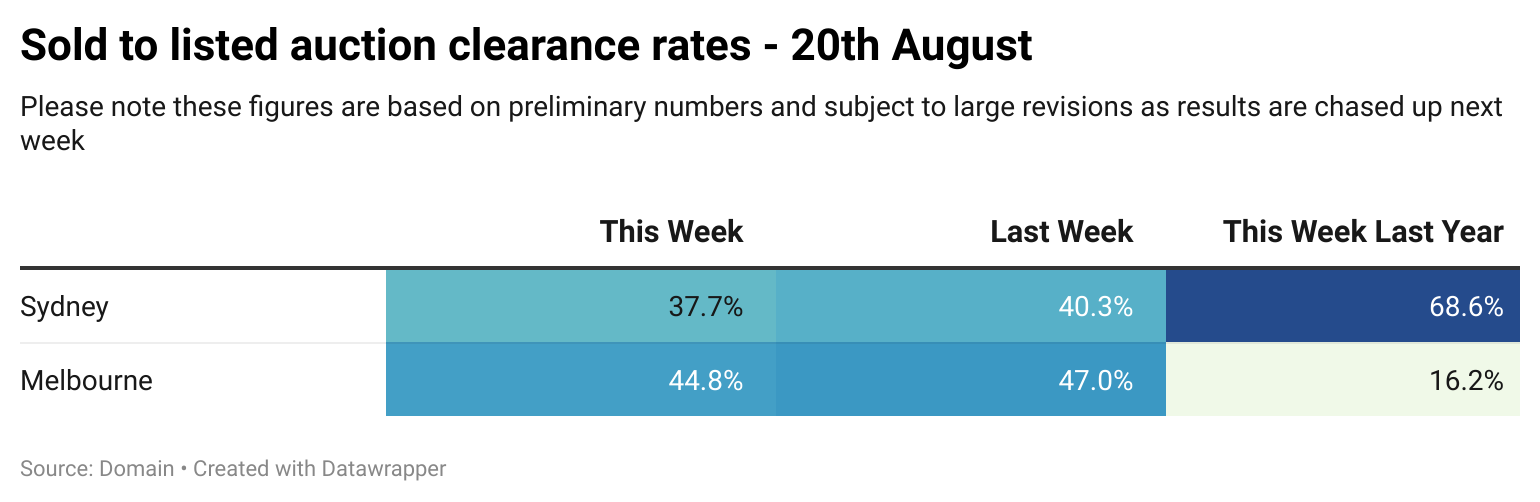
After last weeks significant uptick in clearance rates, this week both monitored markets have dropped back toward the longer term trend seen since the RBA began raising rates.
To what degree these slightly stronger results are as a result of a shift in market sentiment due to the factors explored in last weeks roundup remains to be seen, but is worth keeping an eye on.
However, it is worth noting that the highest levels seen in the recent bounce are still significantly lower than other weekends since prices started falling relatively swiftly in Sydney and Melbourne.
In terms of scheduled auction volumes, in Sydney they are relatively similar to this time last year, when Sydney was in its second month of lockdown. In Melbourne, scheduled volumes are less than half of what they were last year.
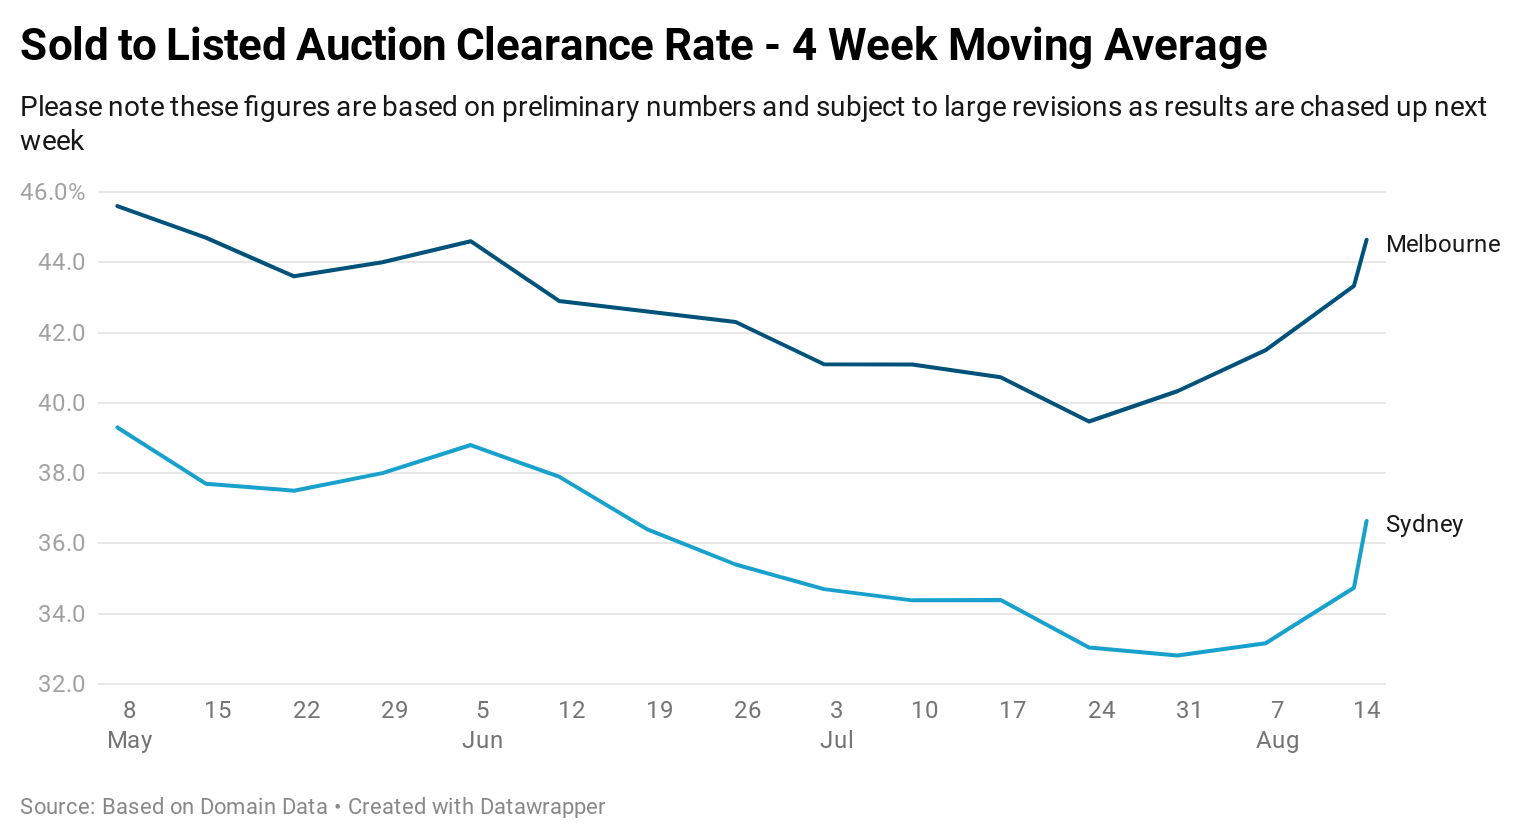
On a 4 week moving average basis since the RBA cut rates, we are seeing a continued lift for both the monitored cities, as a weekend of very weak data feeds out of the metric. It will be interesting to see how the market performs when the spring selling season begins next month.
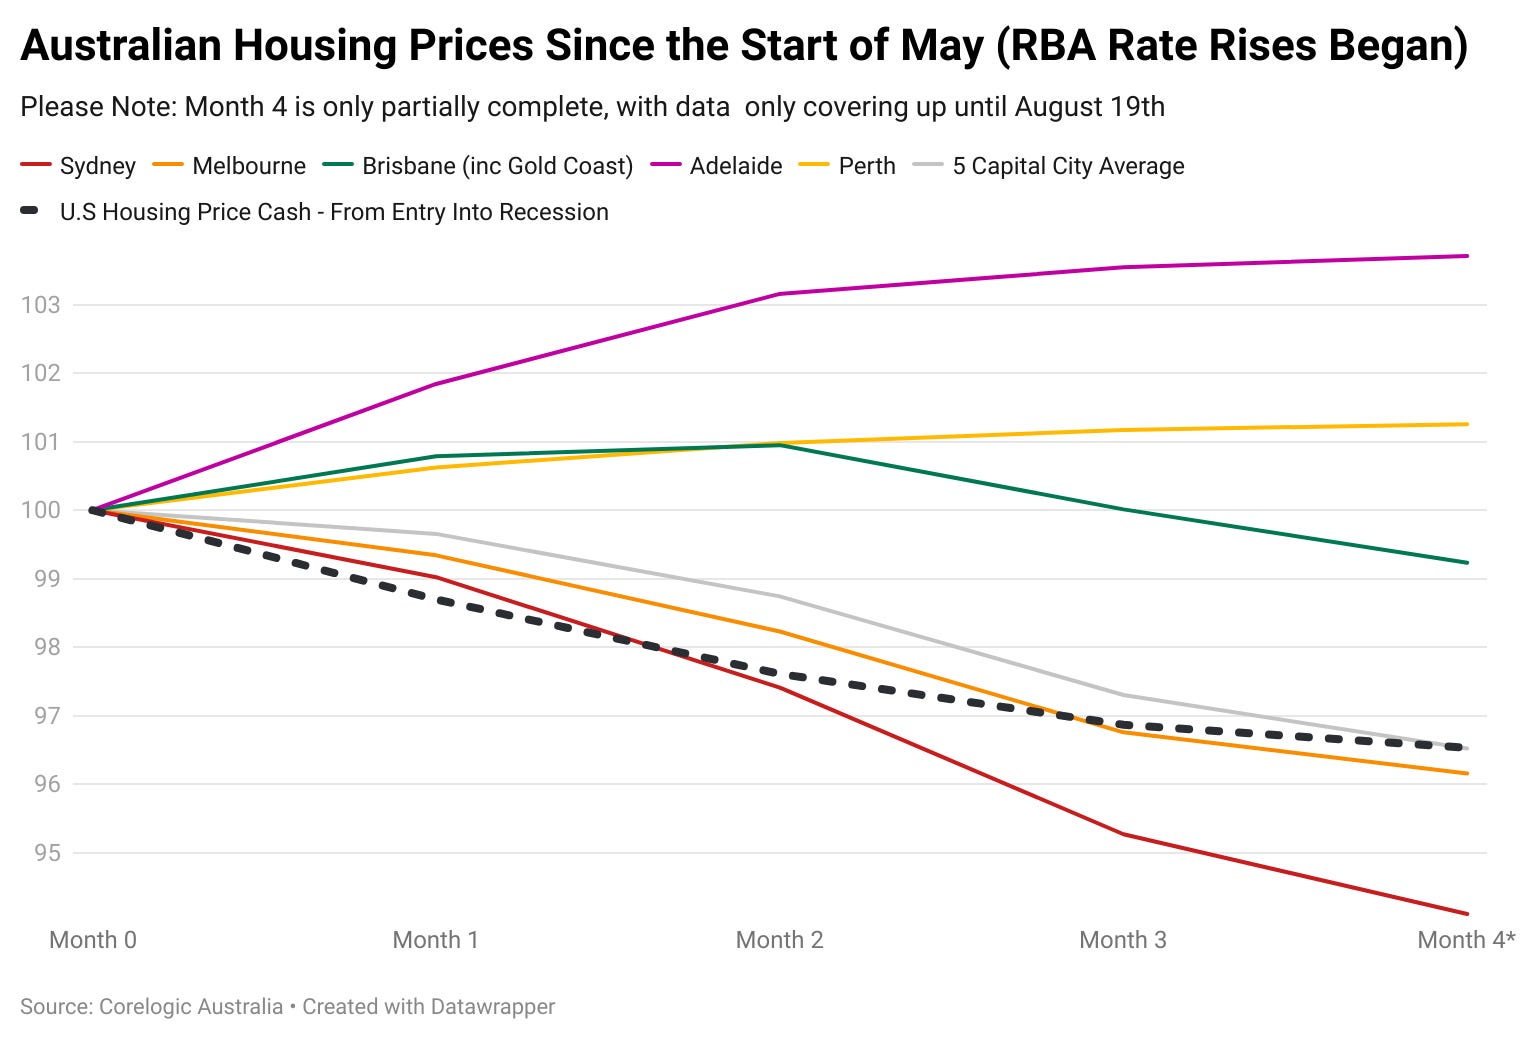
Meanwhile, the outcomes seen by different markets continue to remain highly divergent.
In Sydney, prices are falling at the most rapid rate in almost 40 years according to Corelogic, dropping significantly faster than the U.S housing market during the global financial crisis recession.
At the other end of the spectrum Adelaide continues to perform strongly despite seeing a slow down in price growth in recent weeks.
In Brisbane, early resilience to the tightening of monetary policy has proven short lived, with the city joining Sydney and Melbourne in prices falling.
In Perth, the market has been broadly flat in recent weeks, with the city continuing to show its resilience arguably due to lower home prices.
Highly disparate outcomes appear to continue to be the order of the day as monetary policy continues to tighten.
Q&A
Why are these numbers different to those provided by Corelogic or Domain?
This data is based upon the percentage of scheduled auctions that resulted in a sale of the property as of the time of the initial reporting by agents on Saturday evening.
The data from Corelogic and Domain is based upon the number of successful auctions divided by the number of auctions reported by agents and other property industry figures.
— If you would like to help support my independent data gathering efforts by donating that would be much appreciated, you can do so via Paypal here or via Buy me a coffee.
Thank you for your readership.
