Aussie Property and Auction Report - September 3rd 2022
Complete with coverage of Corelogic's August house price data and ABS housing credit figures

Please note the following is based off preliminary numbers and is subject to significant changes once unreported auctions are chased up.
It should be taken as an extremely rough and preliminary indicator, before other data sources fill in the blank later next week.
For those wanting more accurate data with the missing pieces filled in, that is posted here by the great team at SQM Research on Tuesdays.
Auction Action Summary
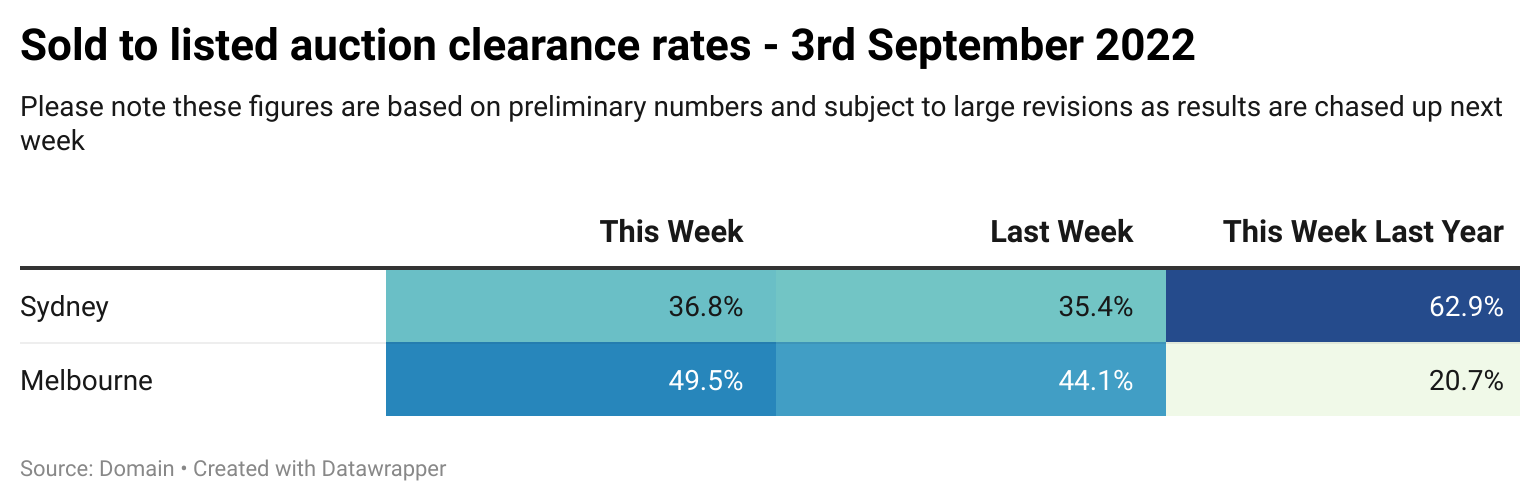
The divergence in outcomes between Sydney and Melbourne continues.
Melbourne has bounced quite strongly to its highest preliminary clearance rate since early April, which was from well before the RBA started raising interest rates. While one couldn’t call this outright strength, Melbourne’s housing market isn’t falling as fast as Sydney or Brisbane, despite falling swiftly compared with recent historical examples.
Meanwhile, in Sydney we got a weekend roughly on par with last week and whatever bounce was evident in the market very briefly a few weeks ago seems to have faded somewhat.
Property insider Catherine Cashmore made the comment that:


Cashmore has made this point several times in recent months and I think it bears worth repeating. Unlike previous cycles where vendors would simply not list their property in a falling market, they are still doing so in large numbers relative to the 2017-2019 property market downturn.
Ironically this begins to ask some questions for clearance rates as an indicator, because if vendors are meeting the market rather than simply letting the auction fail as they would in a more normal market, the relative strength of clearance rates may be masking much greater market weakness.
4 Week Moving Average
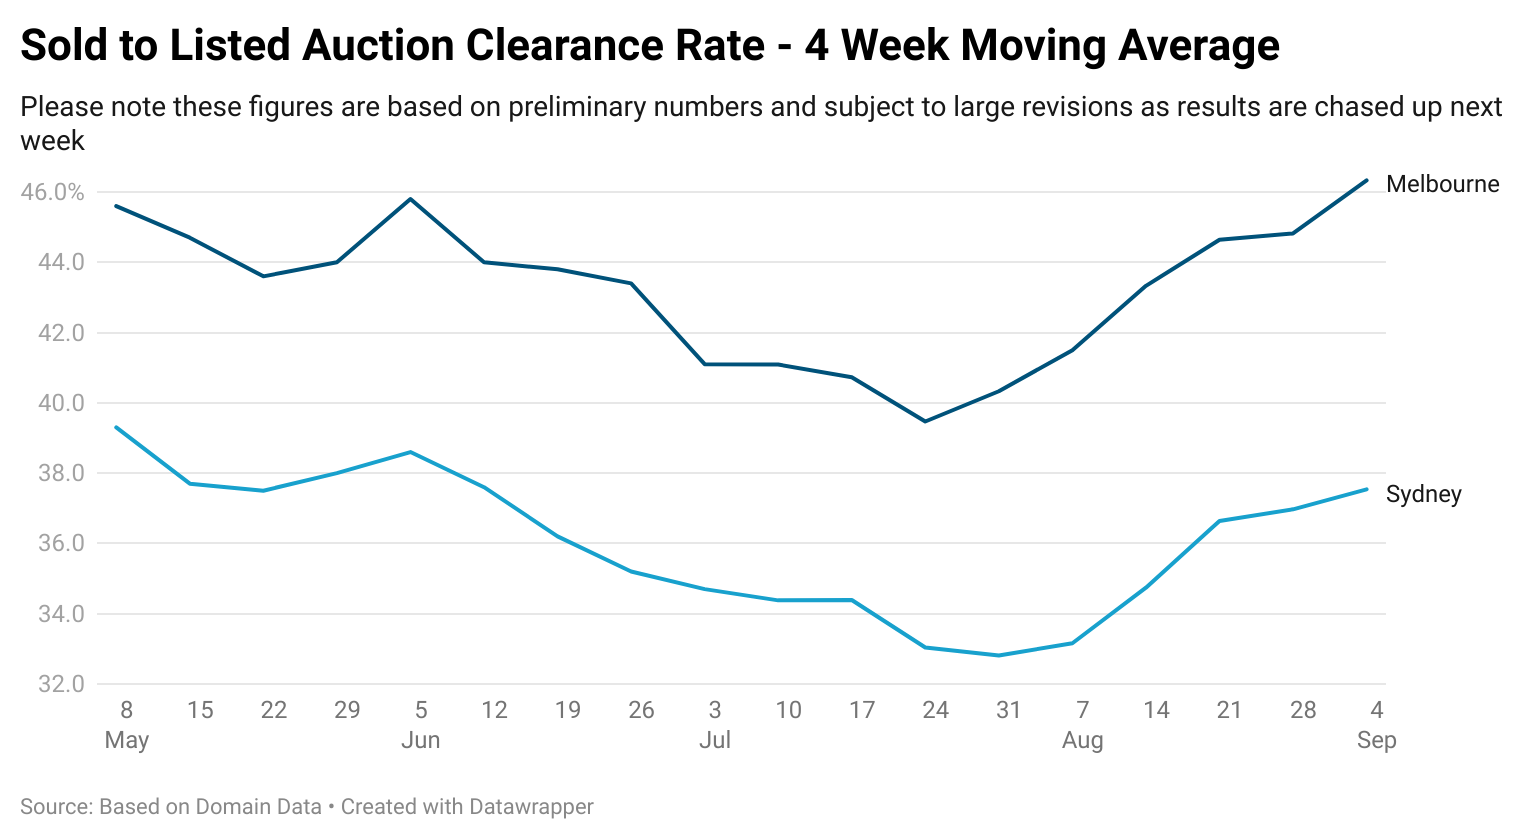
On a 4 week moving average basis since the RBA cut rates, we are seeing a continued lift for both the monitored cities. It will be interesting to see how the market performs when the spring selling season really kicks off and greater volumes of properties hit the market.
Market News
Earlier this week the ABS released the housing finance data for July and it was a sea of red.
In month on month terms:
Housing overall - Down 8.5%
Owner occupier housing - Down 7.0%
Investor housing - Down 11.2%
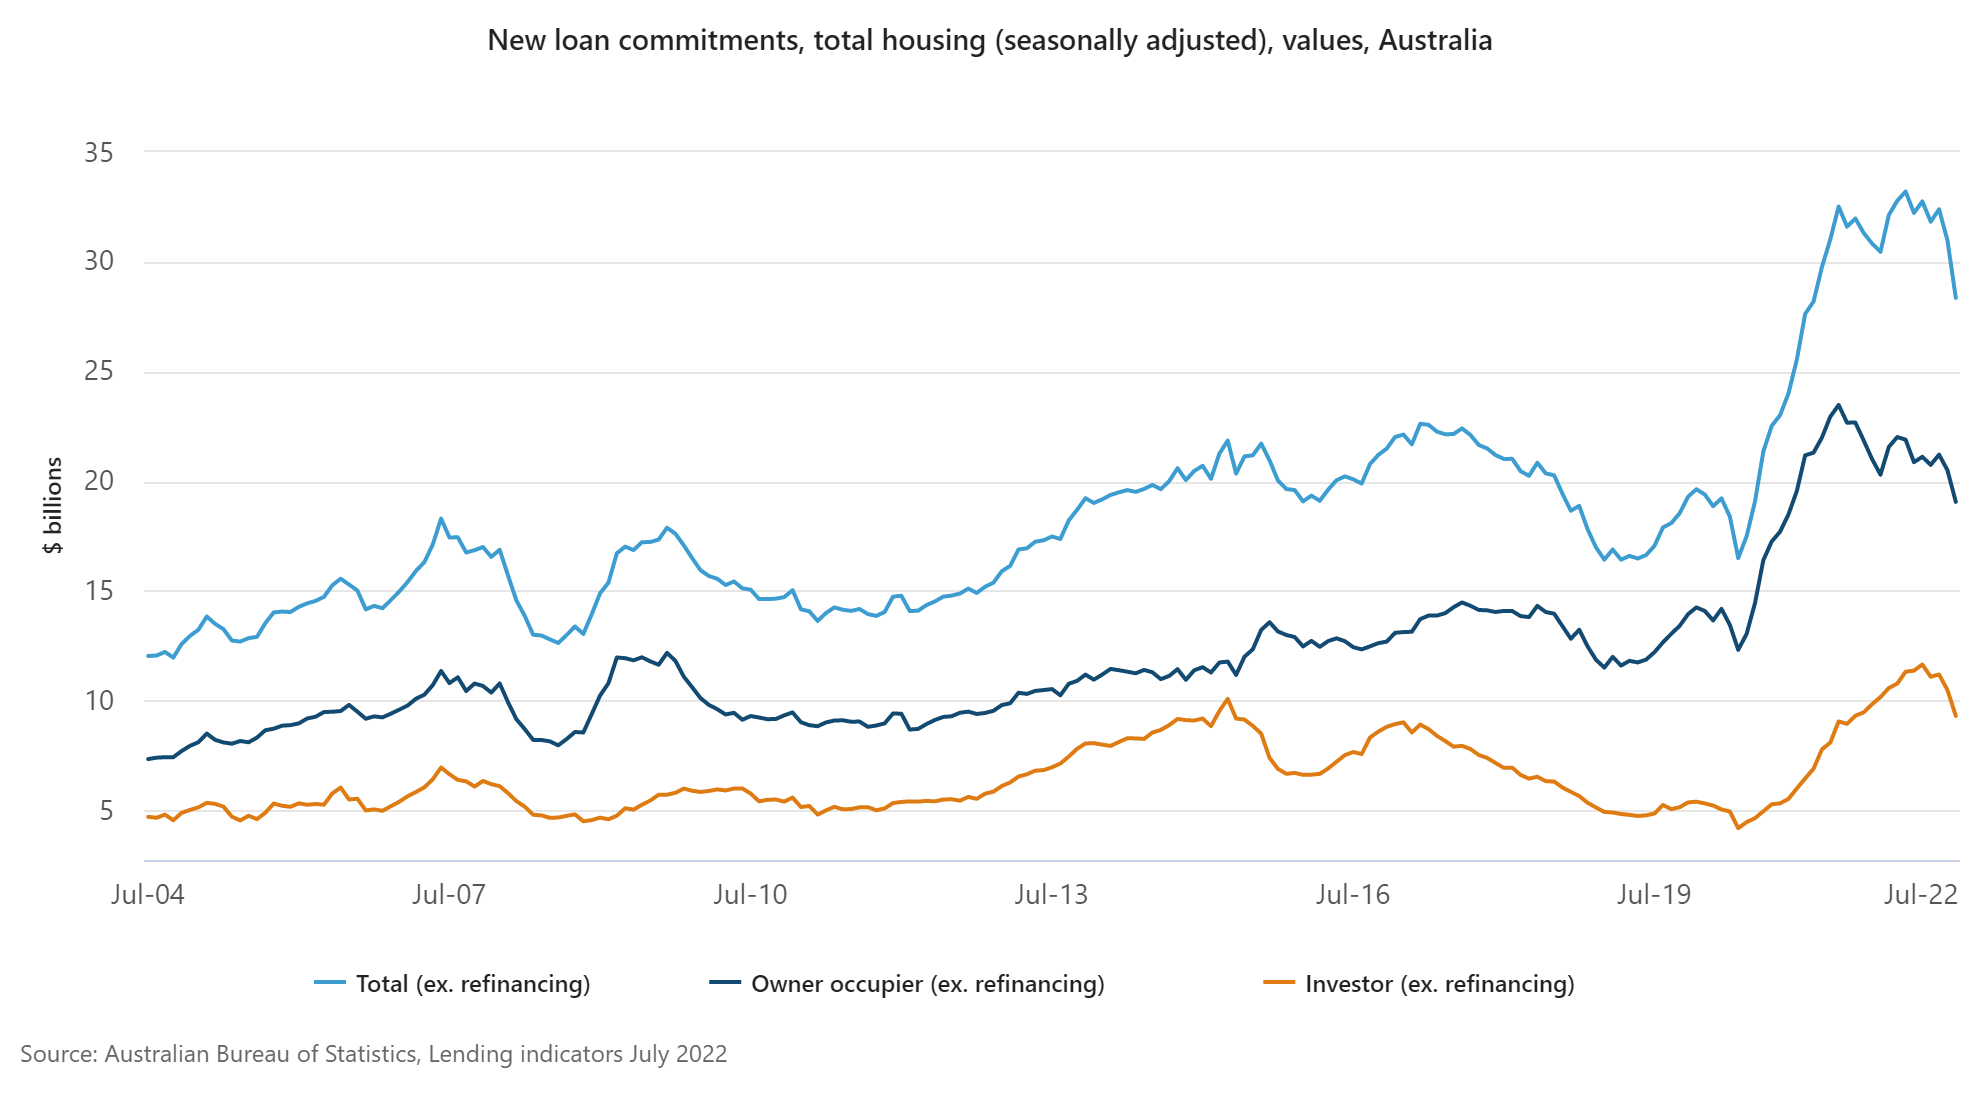
Broadly speaking housing credit growth is a solid indicator for the future direction of housing prices and has been the canary in the coal mine for market cycles for decades, both to the upside and the downside.
While overall new housing loan volumes (in dollar terms) are down 14.6% from their peak, this is arguably only the beginning of the falls in this metric. With the borrowing power of households falling rapidly due to rising interest rates, there is more downside ahead.
However, it is worth noting that average loan sizes have remained near record highs.
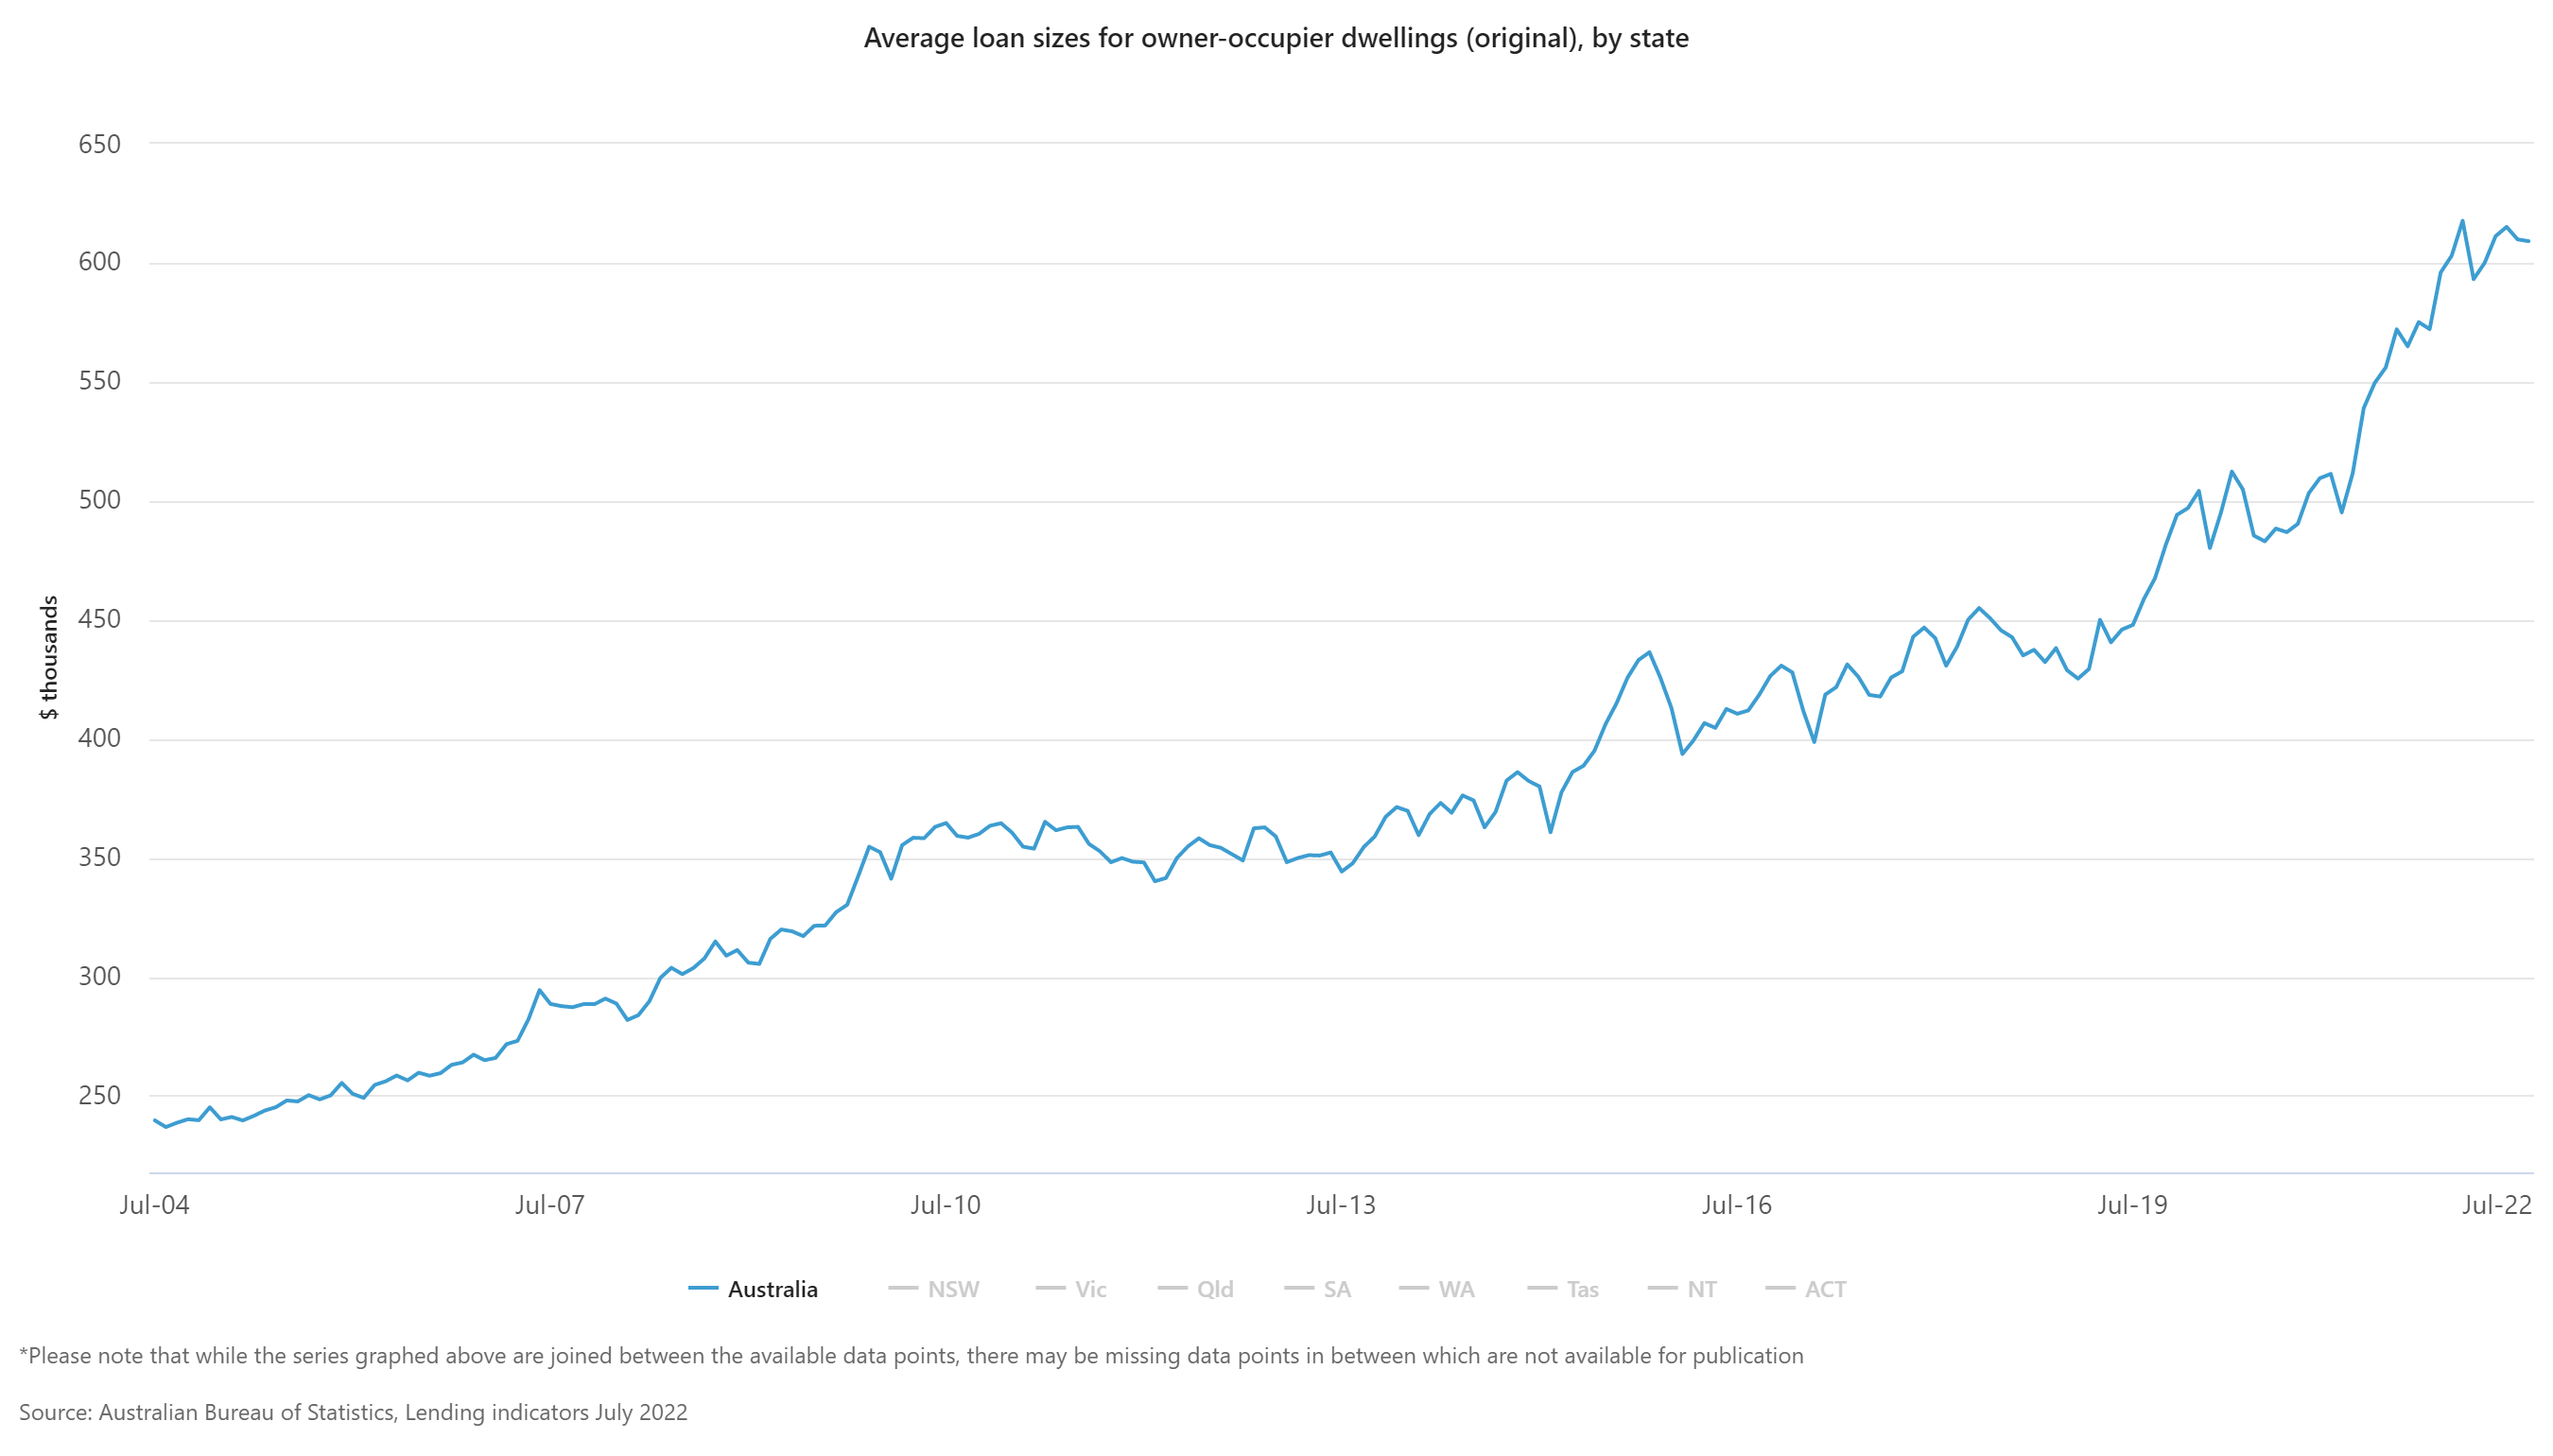
While there are a number of theories as to why, arguably the most likely is that higher income households are still buying homes, while those on lower incomes who are hit harder by rising rates and inflation are either buying less expensive homes or simply not transacting.
This could be why some areas appear to be bucking the broader trend and auctions are still performing relatively well.
In terms of house prices, August produced the first month of price falls across all the capital cities covered by Corelogic’s Daily Index since the initial shock of the pandemic.
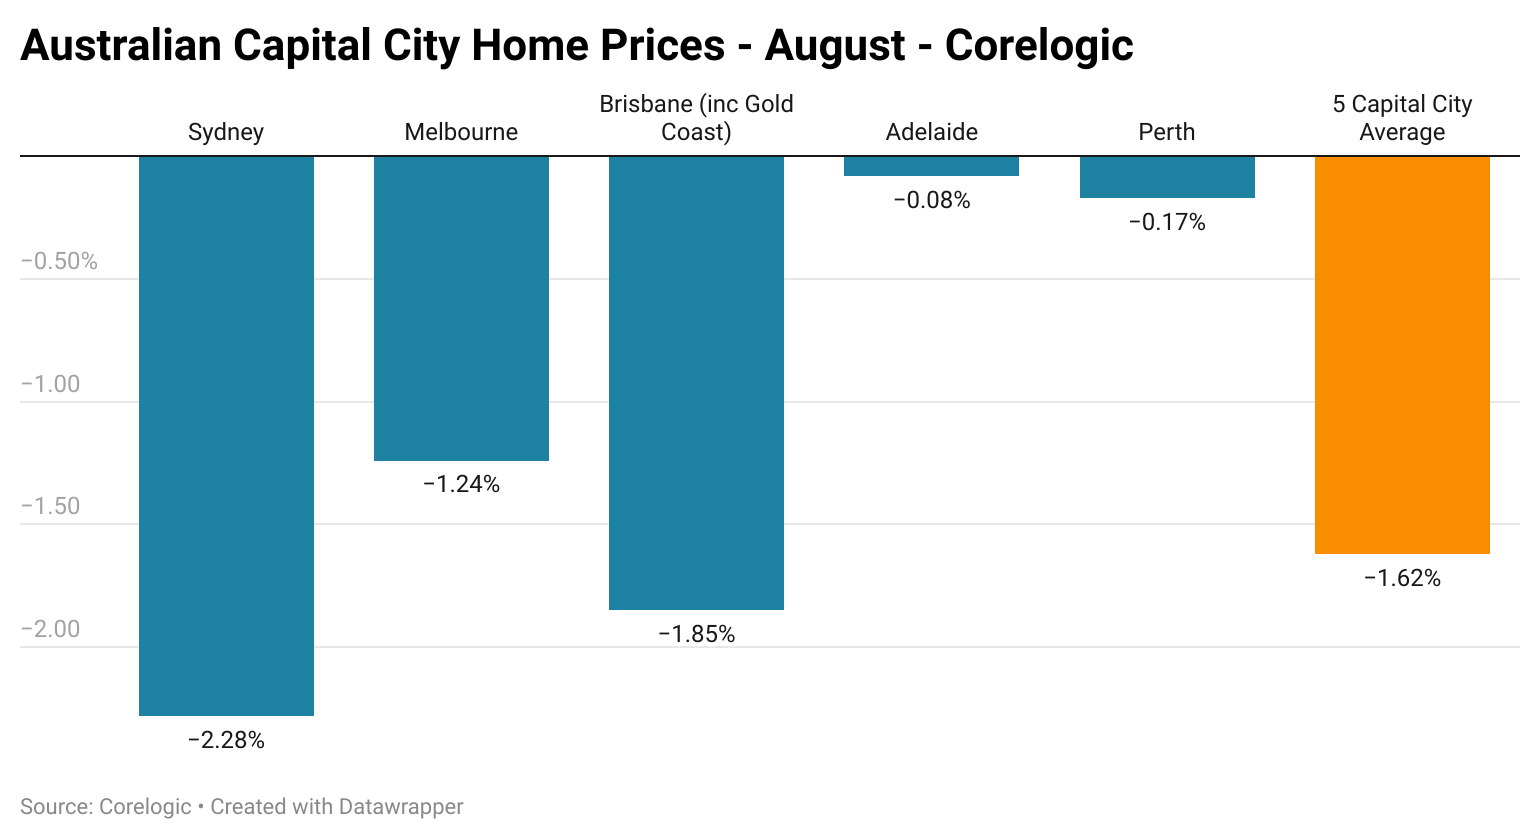
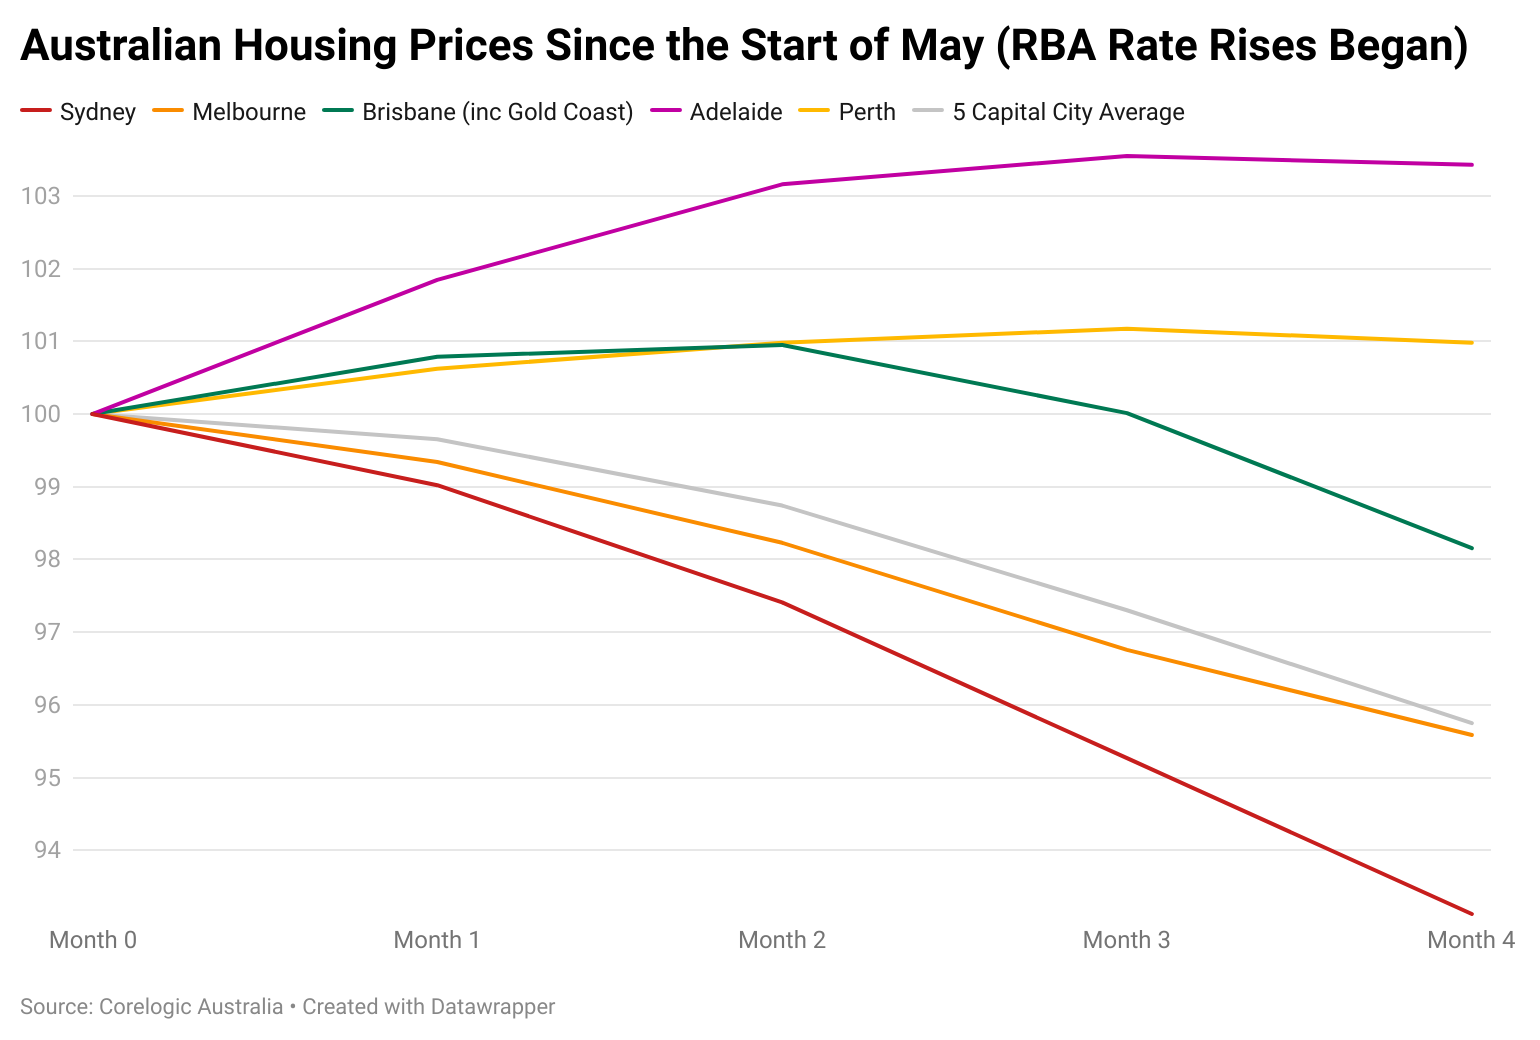
While Brisbane initially maintained its momentum in the face of rising rates, it has since become the nation’s second worst performer, with prices falling by 1.85% in August.
Of all the nation’s housing markets it has been the quickest to turn so negative, with some analysts commenting that it had also had some of the most rapid price appreciation in the nation.
— If you would like to help support my independent data gathering efforts by donating that would be much appreciated, you can do so via Paypal here or via Buy me a coffee.

If you would like to support my work on an ongoing basis, you can do so here via Patreon or via Paypal here

Thank you for your readership.
Q&A
Why are these numbers different to those provided by Corelogic or Domain?
This data is based upon the percentage of scheduled auctions that resulted in a sale of the property as of the time of the initial reporting by agents on Saturday evening.
The data from Corelogic and Domain is based upon the number of successful auctions divided by the number of auctions reported by agents and other property industry figures.
Thanks once again for your insights. Your comment on the efficacy of Auction clearance rates as an indicator were especially prescient