Aussie Property and Auction Report - September 10th 2022
A mixed bag, some improvement in Sydney and slightly weaker in Melbourne

Please note the following is based off preliminary numbers and is subject to significant changes once unreported auctions are chased up.
It should be taken as an extremely rough and preliminary indicator, before other data sources fill in the blank later next week.
For those wanting more accurate data with the missing pieces filled in, that is posted here by the great team at SQM Research on Tuesdays.
Auction Action Summary
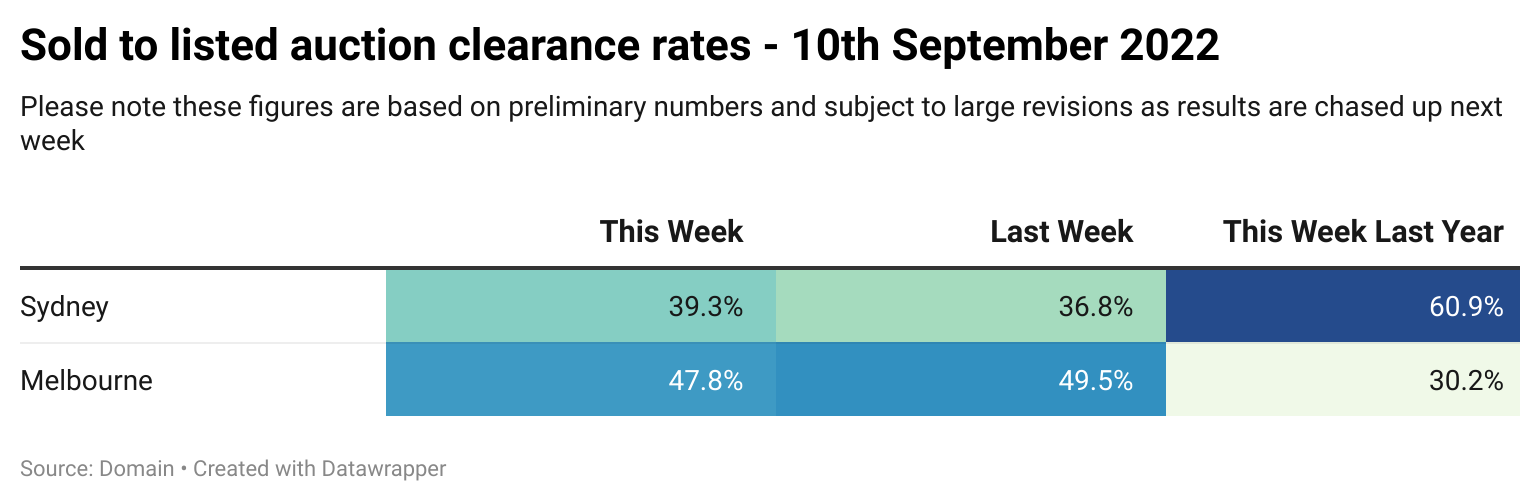
A mixed bag relatively to last week, Sydney performing slightly better and Melbourne slightly weaker.
That being said, the divergence between outcomes in Sydney and Melbourne continues, with the Sydney market continuing to fall significantly faster than Melbourne according to the Corelogic Daily Index.
Ultimately, the state of the market comes down to the question in last weeks update. Are vendors meeting the market and therefore inflating clearance rates that would otherwise be much weaker?
So let’s take a step back in time for a moment to do a comparison. For the purpose of this exercise we will be looking at the Sydney market, due to it being my most extensive data set.
During November 2018 Sydney saw clearance rates between 32% and 35%, on average those are significantly weaker numbers than what we are seeing at the moment. Yet despite this, housing prices are falling much faster now than they were during that peroid in 2018.
These results came toward the latter half of the Sydney housing market correction during 2017-2019.
Which brings us back to the big question, is the headline result at least partially driven by vendors meeting the market and not broader market strength?
The evidence suggests that to some degree that may be the case.
4 Week Moving Average
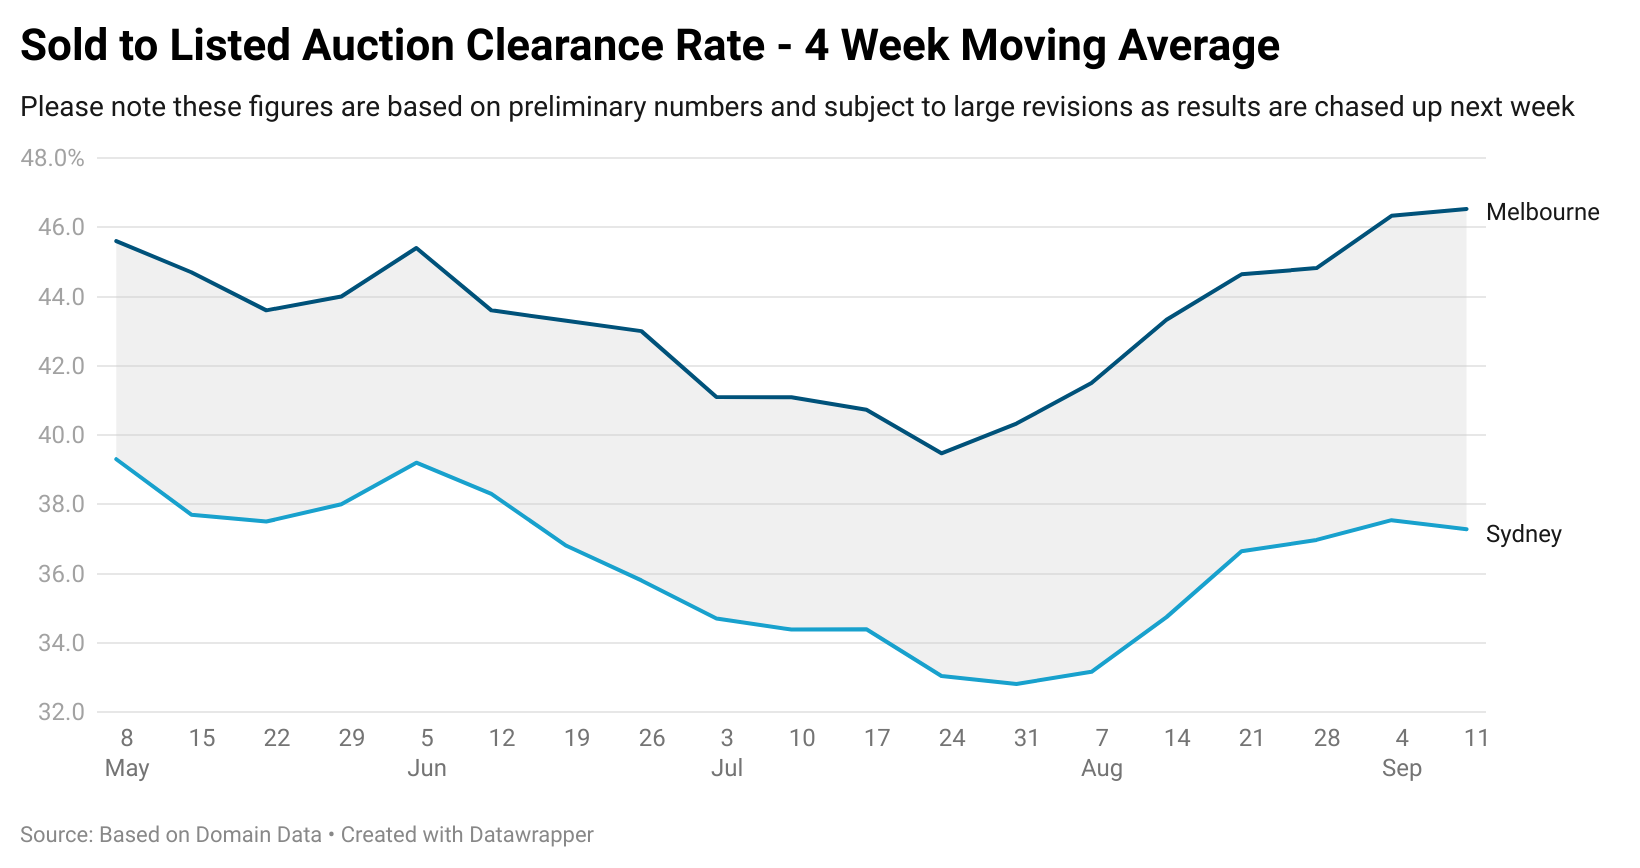
Overall both cities were relatively flat on a 4 week moving average basis relative to last week, with Melbourne up marginally and Sydney down slightly.
From the Twitterverse
Interestingly, buyers agent Edwin Almeida is seeing plenty of stock on the market, with over 22,000 homes open for inspection this weekend.
But less than 550 auctions scheduled according to some metrics. Hardly a display of confidence by vendors in terms of putting their properties under the hammer.


Meanwhile the areas in Sydney monitored by Twitter user Parrapower, roughly a 40% clearance rate was seen, which reflects what the data suggests for the city more broadly.

— If you would like to help support my independent data gathering efforts by donating that would be much appreciated, you can do so via Paypal here or via Buy me a coffee.

If you would like to support my work on an ongoing basis, you can do so here via Patreon or via Paypal here

Thank you for your readership.
Q&A
Why are these numbers different to those provided by Corelogic or Domain?
This data is based upon the percentage of scheduled auctions that resulted in a sale of the property as of the time of the initial reporting by agents on Saturday evening.
The data from Corelogic and Domain is based upon the number of successful auctions divided by the number of auctions reported by agents and other property industry figures.